Compare Two Plants Side by Side in an App
Running two plants side by side only teaches you something if you can actually compare them, and 'comparing them' means more than glancing back and forth between pots. Two plants in the same tent can live in measurably different conditions, and the differences that matter — growth pace, watering rhythm, feed strength — are the ones invisible to the eye. GrowScope's Plant Compare feature exists for exactly this, and this article covers what it compares, where the data comes from, and how the optional AI difference analysis works.
What Plant Compare is — and what it isn't
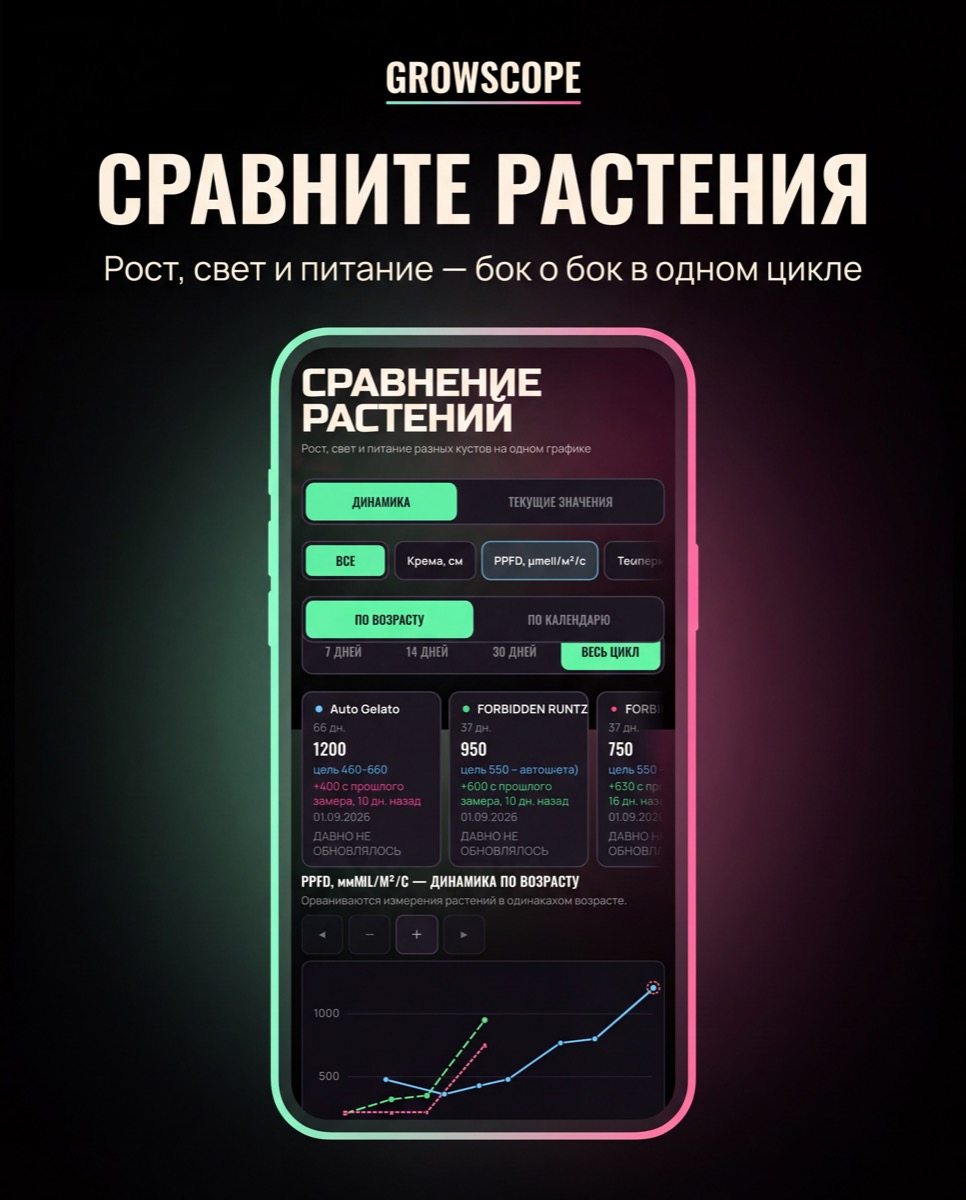
Plant Compare charts multiple of your own plants against each other, on the Compare screen. It is built automatically from each plant's existing history, so there is nothing to enter — the same logs you were already keeping, growth measurements, waterings, climate readings, feedings, become the comparison. It is worth being precise about scope, because the name invites confusion: Plant Compare is strictly your plants against each other. It is not a benchmark against other growers — that is the separate Grower Benchmarks feature — and it is not a comparison against your own past cycles, which is Grow Coach. Three comparison features, three different questions, and Plant Compare answers the one about the plants in front of you.
Dynamics or current values — the two comparison modes
The Compare screen offers two ways to look. 'Dynamics' compares a trend over time — this plant's growth curve against that one's, week by week — which is the mode for answering whether one plant is developing differently, and when the divergence started. 'Current values' compares where the plants stand right now across a chosen metric, which is the mode for a quick 'which one is running hotter, drier, or taller today' check. In both modes you select which plants and which metrics to include, and the metrics span the five things a grow actually consists of: growth, light, climate, nutrition, and watering. Choosing the metric matters more than it sounds — the same two plants can be neck and neck on growth while being complete opposites on watering rhythm.
The AI difference analysis — what it adds and where it stops
Charts answer 'are these plants different?' but not 'what does the difference mean?' For that, Plant Compare offers an optional AI difference analysis: a written comparison between two plants, generated from their records. Two things are worth knowing about it. First, it is a Pro feature gated on AI credits — the charting itself is free, and the written analysis is the paid layer on top, which is the same split the app applies to its other AI features. Second, it works the same way every AI-credit-gated feature in GrowScope works: triggered only by you tapping the action, with the specific data that analysis needs sent once to generate the response, and nothing sent automatically or in the background. If you only ever use the charts, you lose nothing structural — the differences are still visible, just not narrated.
When comparing your own plants actually pays off
Side-by-side comparison earns its keep in a few specific situations. Running the same strain under different conditions — a test of a new light position or feed schedule — becomes a real experiment when both plants' curves sit in one chart. Running different strains in one space exposes the fact that they drink and eat at different rates, which a shared watering schedule quietly ignores. And a plant that seems 'off' next to a healthy sibling gets its suspicion confirmed or dismissed by data instead of by mood: if its climate and nutrition metrics match its neighbour's and only its growth curve lags, that is a completely different problem than an environment difference. The comparison is only as good as the records underneath it, which is why the fact that it builds itself from existing history — no extra logging burden — matters more than any chart styling.
How GrowScope helps
Plant Compare lives on GrowScope's Compare screen and requires no extra input — choose Dynamics or Current values, pick your plants and metrics across growth, light, climate, nutrition, or watering, and the chart assembles itself from each plant's existing history. If you want the differences explained rather than just shown, the optional Pro AI difference analysis writes the comparison between two plants.
Key takeaway
Plant Compare charts your own plants against each other across growth, light, climate, nutrition, and watering — free as a chart, with an optional Pro AI-written difference analysis — and it is strictly your plants, not other growers' data.