Put your plants side by side on one chart and see who's actually ahead.
GrowScope charts your own plants — growth, light, climate, feeding, or watering — with no extra data entry: it pulls straight from each plant's history you've already recorded. The chart itself is free; on Pro, AI can also write a comparison explaining exactly how two chosen plants differ.
The problem
With two or three plants in the same cycle, it's easy to lose track of which one is actually pulling ahead and which one is quietly falling behind. Flipping between plant cards one at a time and holding the numbers in your head is an unreliable way to catch a difference, especially while it's still small.
Why it's hard to solve alone
One plant falling behind on light, watering, or growth rate is almost always explainable and fixable if you catch it early. Without a side-by-side chart, that gap usually goes unnoticed until it's visible to the naked eye — by which point it's harder to close.
How GrowScope helps
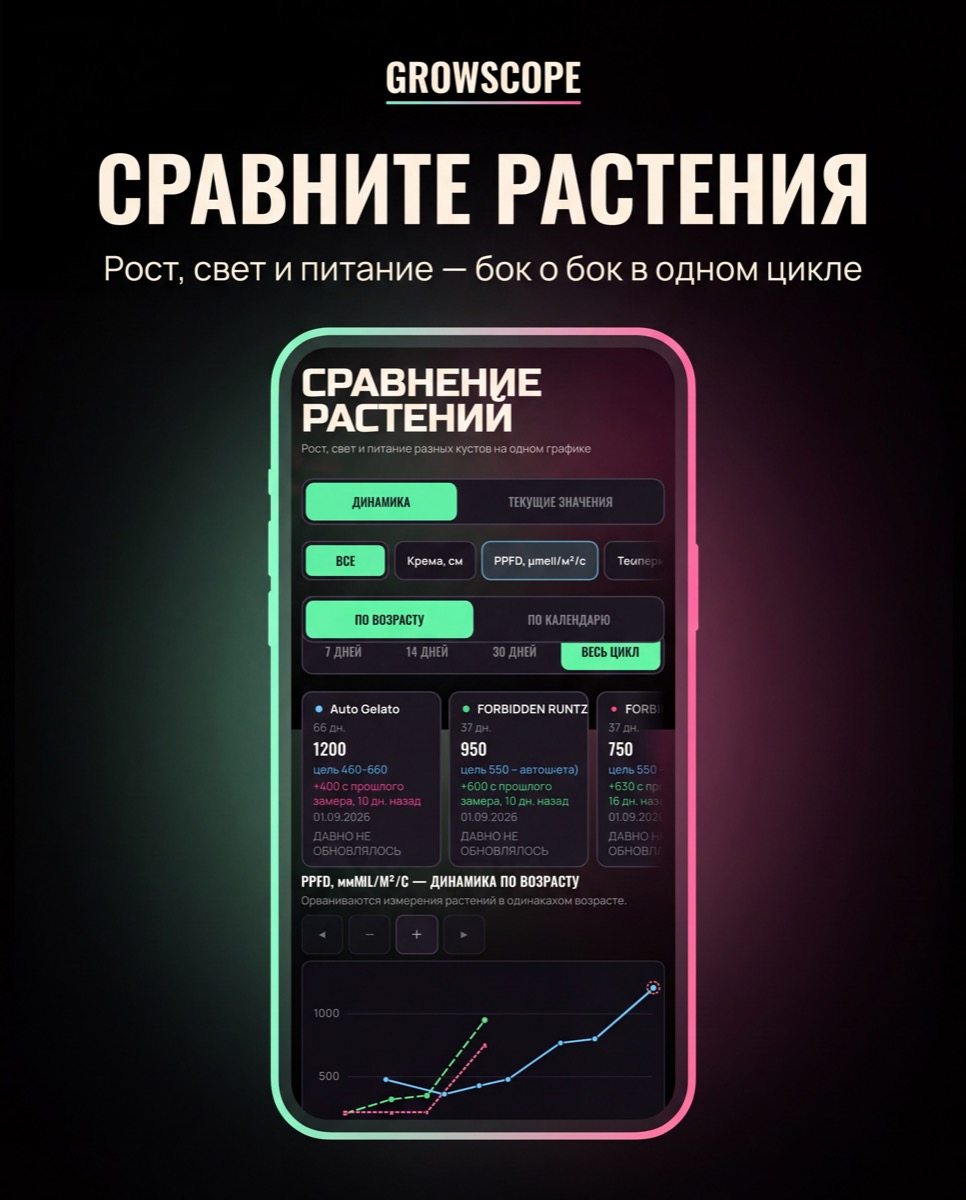
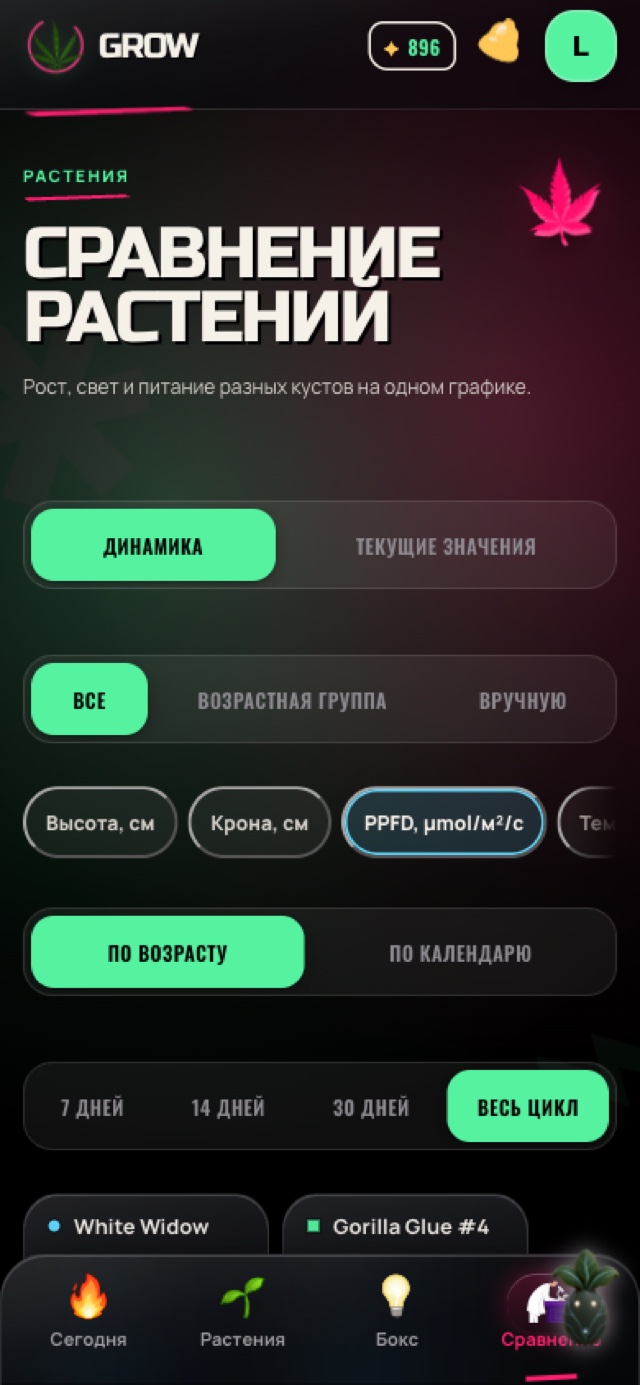
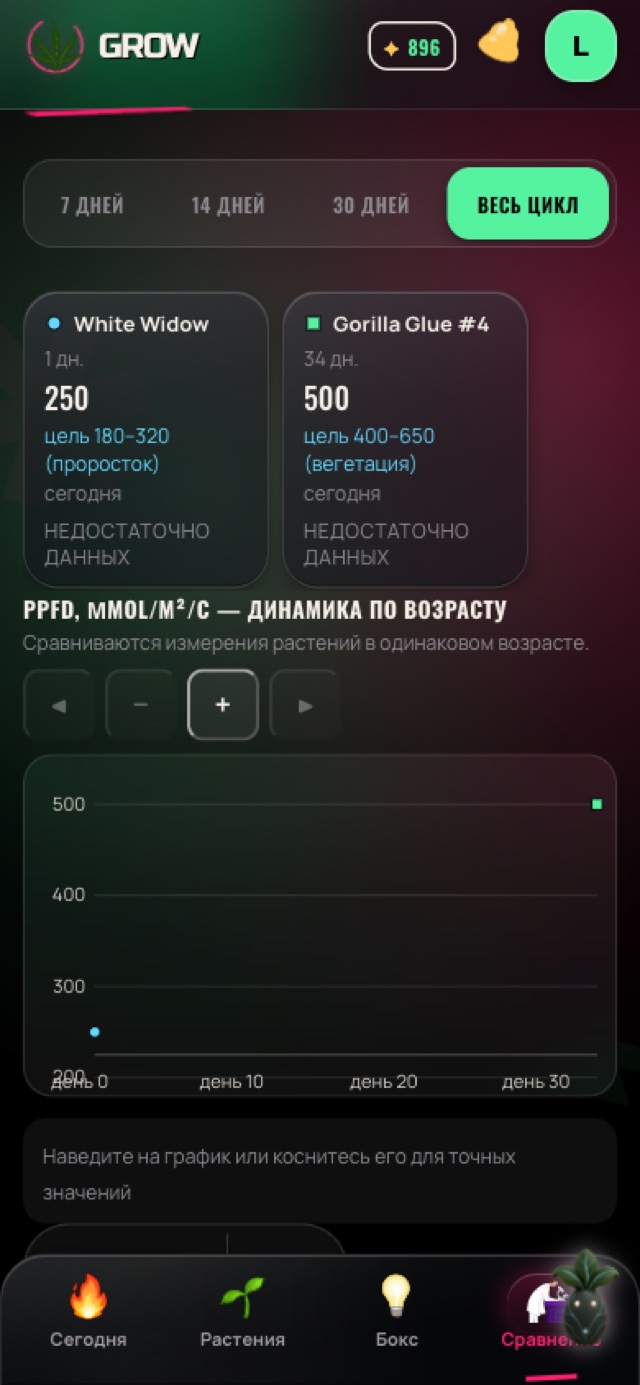
On the Compare screen, choose Trend (over time) or Current Values, pick the plants and a metric — growth, light, climate, feeding, or watering — and GrowScope charts it from each plant's already-recorded history, no extra input needed. On Pro, you can additionally request an AI difference analysis — a written comparison explaining what's behind the gap between two chosen plants.
How it works
- Open the Compare screen — data comes from the history GrowScope already keeps for every plant, nothing needs to be entered again.
- Choose Trend for a chart over time, or Current Values for a snapshot right now.
- Pick which plants to compare and which metric — growth, light, climate, feeding, or watering.
- The chart itself is free for any number of plants on your account — there's no plan restriction on it.
- Optionally, on Pro, run an AI difference analysis — it spends AI credits and produces a written explanation of how one plant differs from another.
In the app
What you get
You see which plant is actually ahead and which is falling behind on one chart — instead of comparing plant cards from memory.
Frequently asked questions
Is Plant Comparison a paid feature?
The chart itself isn't — it's free for any number of plants on your account. Only the optional AI difference analysis is Pro, and it spends AI credits to produce a written explanation of the gap between two plants.
Do I need to enter anything separately to compare plants?
No — the chart is built from the history GrowScope already records for each plant (growth, light, climate, feeding, watering). Opening the Compare screen is enough.
How is this different from Grower Benchmarks?
Plant Comparison only charts your own plants against each other. Grower Benchmarks is a separate feature that anonymously compares your plant or completed cycle against other growers with a similar cycle length.
Can I see a trend, not just current numbers?
Yes — the Trend mode charts a metric over time rather than just a snapshot; switching between it and Current Values happens right on the Compare screen.